
Page 73 - Glass Machinery Plants & Accessories no. 2/2018
P. 73
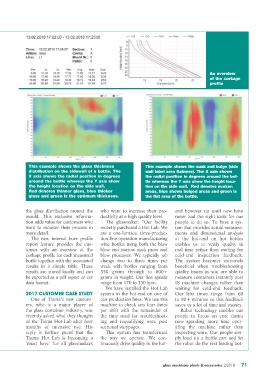
An overview
                                                                                              of the corkage
                                                                                              profile


              This example shows the glass thickness              This example shows the sunk and bulge (side
              distribution on the sidewall of a bottle. The       wall label area flatness). The X axis shows
              X axis shows the radial position in degrees         the radial position in degrees around the bot-
              around the bottle whereas the Y axis show           tle whereas the Y axis show the height loca-
              the height location on the side wall.               tion on the side wall.  Red denotes sunken
              Red denotes thinner glass, blue thicker             areas, blue shows bulged areas and green is
              glass and green is the optimum thickness.           the flat area of the bottle.


             the glass distribution around the   who want to increase their pro-  end however up until now have
             mould. This exclusive informa-   ductivity at a high quality level.   never had the right tools for our
             tion adds value for customers who   The glassmaker: “Our facility   people to do so. To have a sys-
             want to monitor their process in   recently purchased a Hot Lab. We   tem that provides actual measure-
             more detail.                     are a one-furnace, three-produc-  ments and dimensional analysis
               The new internal bore profile   tion-line operation manufacturing   at the hot-end on hot bottles
             report feature provides the cus-  wine bottles using both the blow   enables us to verify quality in
             tomer with an overview of the    blow and narrow neck press and   real time rather than waiting for
             corkage profile for each measured   blow processes. We typically job   cold-end inspection feedback.
             bottle together with the associated   change two to three times per   The system becomes extremely
             results in a simple table. These   week with bottles ranging from   beneficial when troubleshooting
             results are stored locally and can   350 grams through to 800+    quality issues as you are able to
             be exported as a pdf report or csv   grams in weight. Our line speeds   measure containers instantly post
             data format.                     range from 170 to 330 bpm.       IS machine changes rather than
                                                We have installed the Hot Lab   waiting for cold-end feedback.
             2017 CUSTOMER CASE STUDY         system in the hot-end on one of   Our lehr times range from 60
               One of Tiama’s new custom-     our production lines. We use this   to 90+ minutes so this feedback
             ers, who is a major player of    machine to check sets four times   saves us a lot of time and money.
             the glass container industry, was   per shift with the remainder of   Robot technology enables our
             recently asked what they thought   the time used for troubleshoot-  people to focus on core duties
             of the Tiama Hot Lab after four   ing and requalifying ware post   now spending more time oper-
             months of intensive use. His     sectional stoppages.             ating the machine rather than
             reply is further proof that the    This system has transformed    inspecting ware. Our people sim-
             Tiama Hot Lab is becoming a      the way we operate. We con-      ply load up a bottle cart and let
             ‘must have’ for all glassmakers   tinuously drive quality in the hot-  the robot do the rest feeding bot-


                                                                          glass machinery plants & accessories 2/2018  71