
Page 40 - Glass Machinery Plants & Accessories no. 3-2019
P. 40
ENERGY-SAVING
Energy-saving
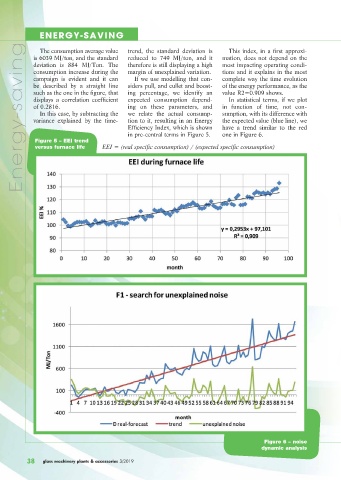
The consumption average value trend, the standard deviation is This index, in a first approxi-
is 6039 MJ/ton, and the standard reduced to 749 MJ/ton, and it mation, does not depend on the
deviation is 884 MJ/Ton. The therefore is still displaying a high most impacting operating condi-
consumption increase during the margin of unexplained variation. tions and it explains in the most
campaign is evident and it can If we use modelling that con- complete way the time evolution
be described by a straight line siders pull, and cullet and boost- of the energy performance, as the
such as the one in the figure, that ing percentage, we identify an value R2=0.909 shows.
displays a correlation coefficient expected consumption depend- In statistical terms, if we plot
of 0.2816. ing on these parameters, and in function of time, not con-
In this case, by subtracting the we relate the actual consump- sumption, with its difference with
variance explained by the time- tion to it, resulting in an Energy the expected value (blue line), we
Efficiency Index, which is shown have a trend similar to the red
in pre-central terms in Figure 5. one in Figure 6.
Figure 5 – EEI trend
versus furnace life EEI = (real specific consumption) / (expected specific consumption)
Figure 6 – noise
dynamic analysis
glass machinery plants & accessories 3/2019
38