
Page 39 - Glass Machinery Plants & Accessories no. 3-2019
P. 39
Or, if we want to ana-
lyze the situation from
another point of view, we
can consider that, com-
pared to a 60 m2 furnace,
a 100 m2 furnace allows
a specific consumption
reduction of 6.2 per cent
at 3 ton/m2day and of 8.2
per cent at 2 ton/m2day
as reported before.
It is important to face
these aspects with an ana-
lytic approach, because
the common practice of
utilizing furnaces of dif-
ferent sizes for different
productions tends to dis-
tort observations. Figure 3: Y trend on furnace
It is, in any case, possible to FURNACE COMPARISON surface for different specific pull
estimate an expected consump- Twenty furnaces were analyzed (Ton/m2d), where Y is the ratio
tion, depending on the primary during the entireness or almost of between the specific consumption
of each furnace and the specific
production information. This their campaigns, based on their consumption of a 60m2 reference
article analyzes the effect of a thermal balance, and a compari- furnace
thermal-dynamic approach to son between previsions and out-
consumption evolution by dis- comes was made. For reasons
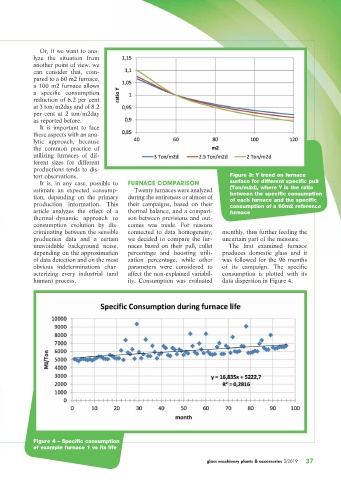
criminating between the sensible connected to data homogeneity, monthly, thus further feeding the
production data and a certain we decided to compare the fur- uncertain part of the measure.
unavoidable background noise, naces based on their pull, cullet The first examined furnace
depending on the approximation percentage and boosting utili- produces domestic glass and it
of data detection and on the most zation percentage, while other was followed for the 96 months
obvious indeterminations char- parameters were considered to of its campaign. The specific
acterizing every industrial (and affect the non-explained variabil- consumption is plotted with its
human) process. ity. Consumption was evaluated data dispersion in Figure 4.
Figure 4 – Specific consumption
of example furnace 1 vs its life
glass machinery plants & accessories 3/2019
37