
Page 43 - Glass Machinery Plants & Accessories no. 3-2019
P. 43
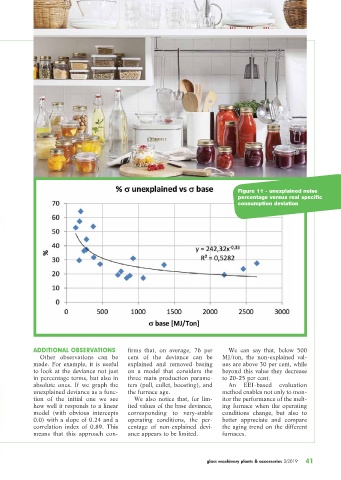
Figure 11 - unexplained noise
                                                                                     percentage versus real specific
                                                                                     consumption deviation


             ADDITIONAL OBSERVATIONS          firms that, on average, 76 per       We can say that, below 500
               Other observations can be      cent of the deviance can be      MJ/ton, the non-explained val-
             made. For example, it is useful   explained and removed basing    ues are above 30 per cent, while
             to look at the deviance not just   on a model that considers the   beyond this value they decrease
             in percentage terms, but also in   three main production parame-  to 20-25 per cent.
             absolute ones. If we graph the   ters (pull, cullet, boosting), and   An EEI-based evaluation
             unexplained deviance as a func-  the furnace age.                 method enables not only to mon-
             tion of the initial one we see     We also notice that, for lim-  itor the performance of the melt-
             how well it responds to a linear   ited values of the base deviance,   ing furnace when the operating
             model (with obvious intercepts   corresponding to very-stable     conditions change, but also to
             0.0) with a slope of 0.24 and a   operating conditions, the per-  better appreciate and compare
             correlation index of 0.89. This   centage of non-explained devi-  the aging trend on the different
             means that this approach con-    ance appears to be limited.      furnaces.


                                                                          glass machinery plants & accessories 3/2019
                                                                                                             41