
Page 41 - Glass Machinery Plants & Accessories no. 3-2019
P. 41
At this point, the consumption quota that is data to time, and then pushed it to the indetermina-
not explained by modelling or by measured aging tion of just 166 MJ/Ton by using modelling. These
is represented in green, and it shows a 166 MJ/Ton trends, with the variables implicit in the specific cases,
average value, instead of the previous 884 MJ/Ton. can be seen in other furnaces, such as:
Therefore, starting from a variance of 884 MJ/
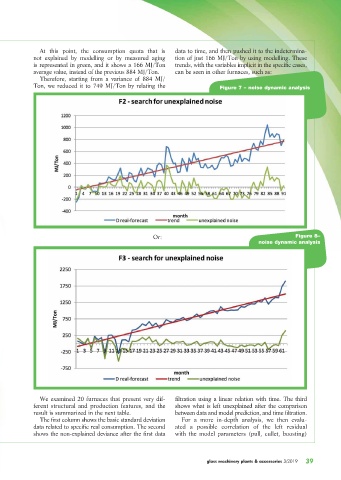
Ton, we reduced it to 749 MJ/Ton by relating the Figure 7 – noise dynamic analysis
Or: Figure 8–
noise dynamic analysis
We examined 20 furnaces that present very dif- filtration using a linear relation with time. The third
ferent structural and production features, and the shows what is left unexplained after the comparison
result is summarized in the next table. between data and model prediction, and time filtration.
The first column shows the basic standard deviation For a more in-depth analysis, we then evalu-
data related to specific real consumption. The second ated a possible correlation of the left residual
shows the non-explained deviance after the first data with the model parameters (pull, cullet, boosting)
glass machinery plants & accessories 3/2019
39